
An innovative way to track water quality improvements is being explored by a team in the Fox-Wolf River Basin. Using satellite imagery in combination with in-person field verification, the team is working to track how green our agricultural fields are throughout the year. Many farmers throughout the Lower Fox River basin, and throughout the state, have been implementing restorative practices into their farming techniques in an effort to protect their local water quality as well as improve the soil they are farming, and this new tool will help measure the adoption of these conservation practices.
The team is measuring land cover through an index called NDTI, or Normalized Difference Tillage Index. Satellites capture images of crop fields and provide an estimation of how much of the soil is covered and how much is bare. Leaving crop residue on the field after harvest, planting cover crops, and utilizing low-disturbance tillage practices decreases erosion and improves soil quality. Better quality soil leads to better infiltration during precipitation events and better infiltration leads to less run-off events.
A lower NDTI value means that there is less green on the field or another way to look at is more tillage has occurred. Higher NDTI values mean that there is more green and less tillage. Through the use of Google Earth Engine and ArcGIS, the NDTI team is able to take these satellite images, overlay the farm fields, and then through coding magic, determine a value for each field. A lot deeper explanation is needed for this technical step, so if you’re interested in learning more, please contact us!
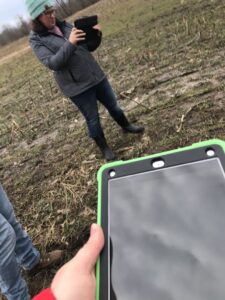 Because satellite images are taken from such a high height and can be skewed by cloud cover or standing water, field verification is needed to confirm the values being found during the computer analysis. This field verification is being completed by local Land Conservation Departments and the Wisconsin DNR through windshield surveys or a quick field stops. As staff visit the fields, they are noting residual crop presence, cover crop presence, tillage, and manure application. During the spring, they are even able to identify which crops are left or cover crops are starting to grow/recover from being covered in snow. The information collected during these surveys can then be used better to validate the NDTI value generated by the satellite imagery.
The team has started to look at the satellite data from the past 5 years and will continue to study it into the future to measure the adoption of land conservation practices throughout the watershed. As this project continues, there may be plans to look at more historic images to see if improvements can be seen from further back in time.
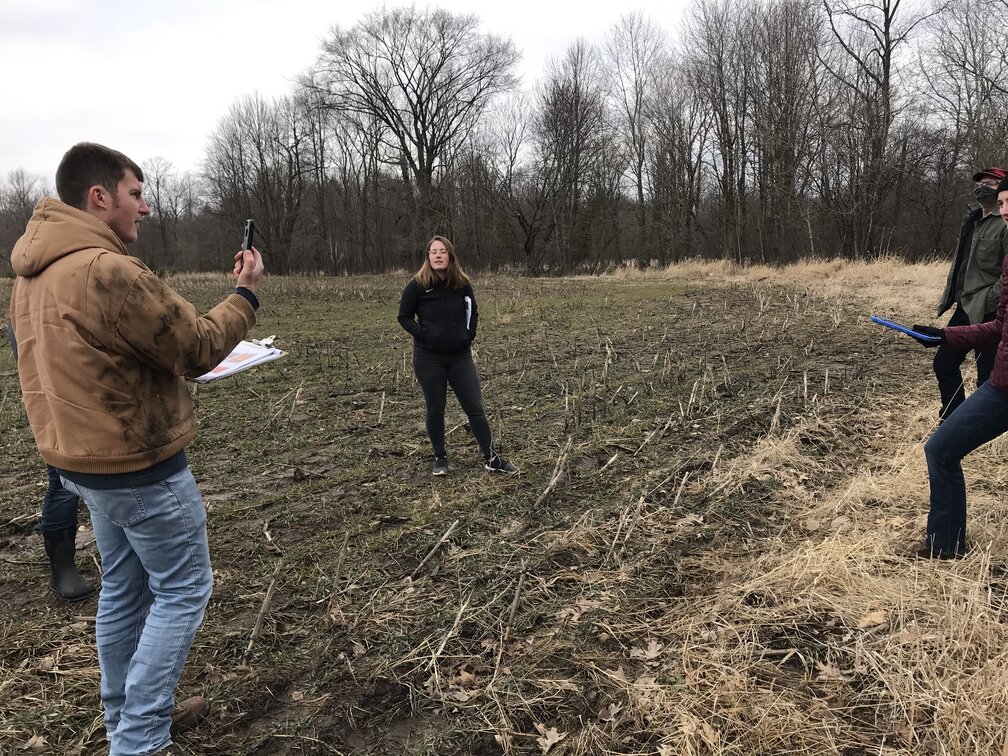
As an example, below are two pictures of agricultural fields in March.
Field one shows a field with corn grain with almost 100% cover. Field two shows a field that had some corn silage left over after a chisel plow went through with less than 10% cover. Field one would have a higher NDTI score than field two.
Field 1

Field 2
