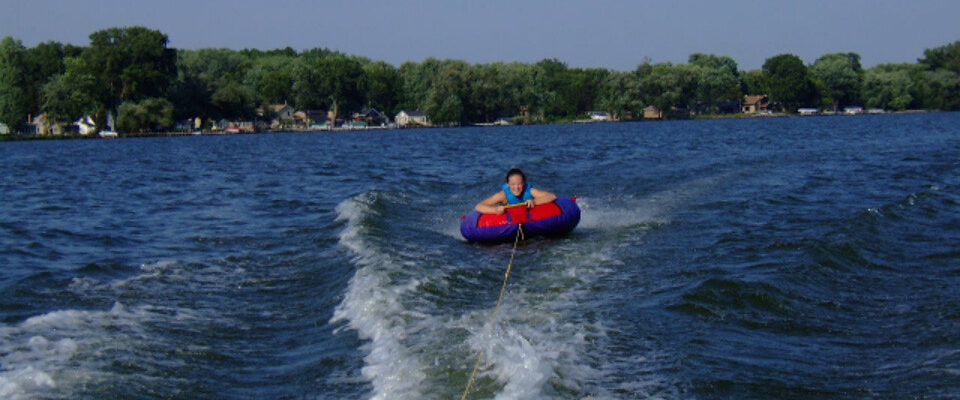
If you’ve ever looked out from your dock or favorite shoreline spot and thought, “Did the water drop?”—you’re not alone. Lake Winnebago’s water levels are constantly shifting throughout the year, and the reasons behind those changes aren’t always so obvious.
Let’s break down how water levels are managed, who’s making those decisions, and how to make sense of a very important graph that gets updated every week. Whether you fish, boat, kayak, live on the shoreline, or just love this wonderful lake—keep reading and discover what’s behind Lake Winnebago’s ups and downs.
This is part of our ongoing Lake Winnebago series. If you missed earlier posts, you can catch up here.
What is the Army Corps’ graph showing?
Each week, the U.S. Army Corps of Engineers updates a water level conditions chart for Lake Winnebago. At first glance, it looks technical—but once you understand a few key elements, it becomes a powerful tool for tracking what’s happening across the lake.
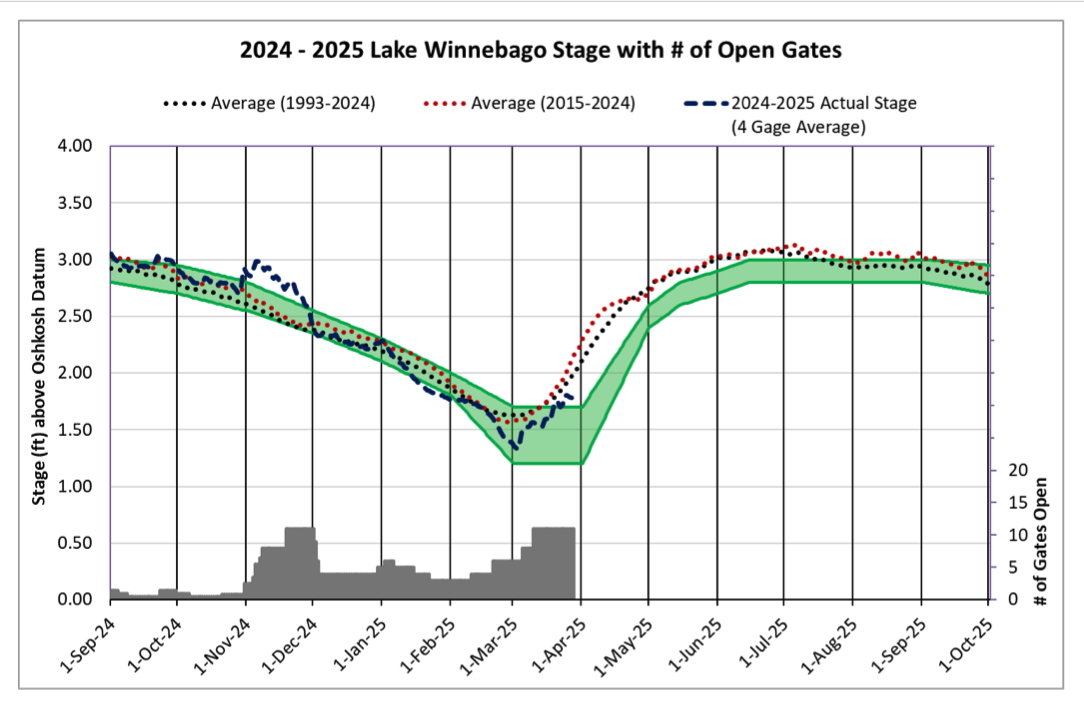
Winnebago Weekly Water Level Graph – 2024–2025
As of March 28, 2025
What does the vertical axis mean?
The left-hand side of the graph shows water level in feet above the Oshkosh Datum—a historic elevation reference point once tied to the elevation of the Menasha Dam’s spillway.
For example, a reading of 1.68 feet means the average lake level is equal in elevation to the crest of the Menasha Dam—not that the lake is 1.68 feet deep. The number reflects lake surface elevation, based on an average from four monitoring points around the lake.
What does the bottom axis show?
The bottom of the graph tracks the calendar year from left to right, showing how water levels change throughout the annual cycle: fall drawdown, winter pool, spring refill, and summer pool.
What are the colored lines and bands?
-
The green band represents the Army Corps’ annual water level strategy—a target zone that balances flood mitigation, shoreline protection, recreation, water quality, fish habitat, and more.
-
The blue dashed line shows the current year’s water level average, based on the four monitoring stations.
-
Black and red dotted lines show historical averages for comparison.
-
The gray bars at the bottom show how many gates are open at the Menasha and Neenah dams. More gates = more water released downstream.
What influences the Army Corps’ decisions each week?
Managing water on a system as large and dynamic as Lake Winnebago involves tracking a wide range of conditions—not just recent rainfall. The Corps takes into account:
-
Time of year, based on their seasonal strategy
-
Inflows from rivers (Upper Fox, Wolf) and direct precipitation
-
Outflows through the Lower Fox River and evaporation
-
Ice cover on the lake
-
Soil moisture and snowpack
-
Depth to frost
-
5-day precipitation forecasts
-
Long-range climate outlooks
-
Expected water level trends
-
Wind conditions (more on that in a future post)
These factors help determine whether more water needs to be held in the system or released downstream.
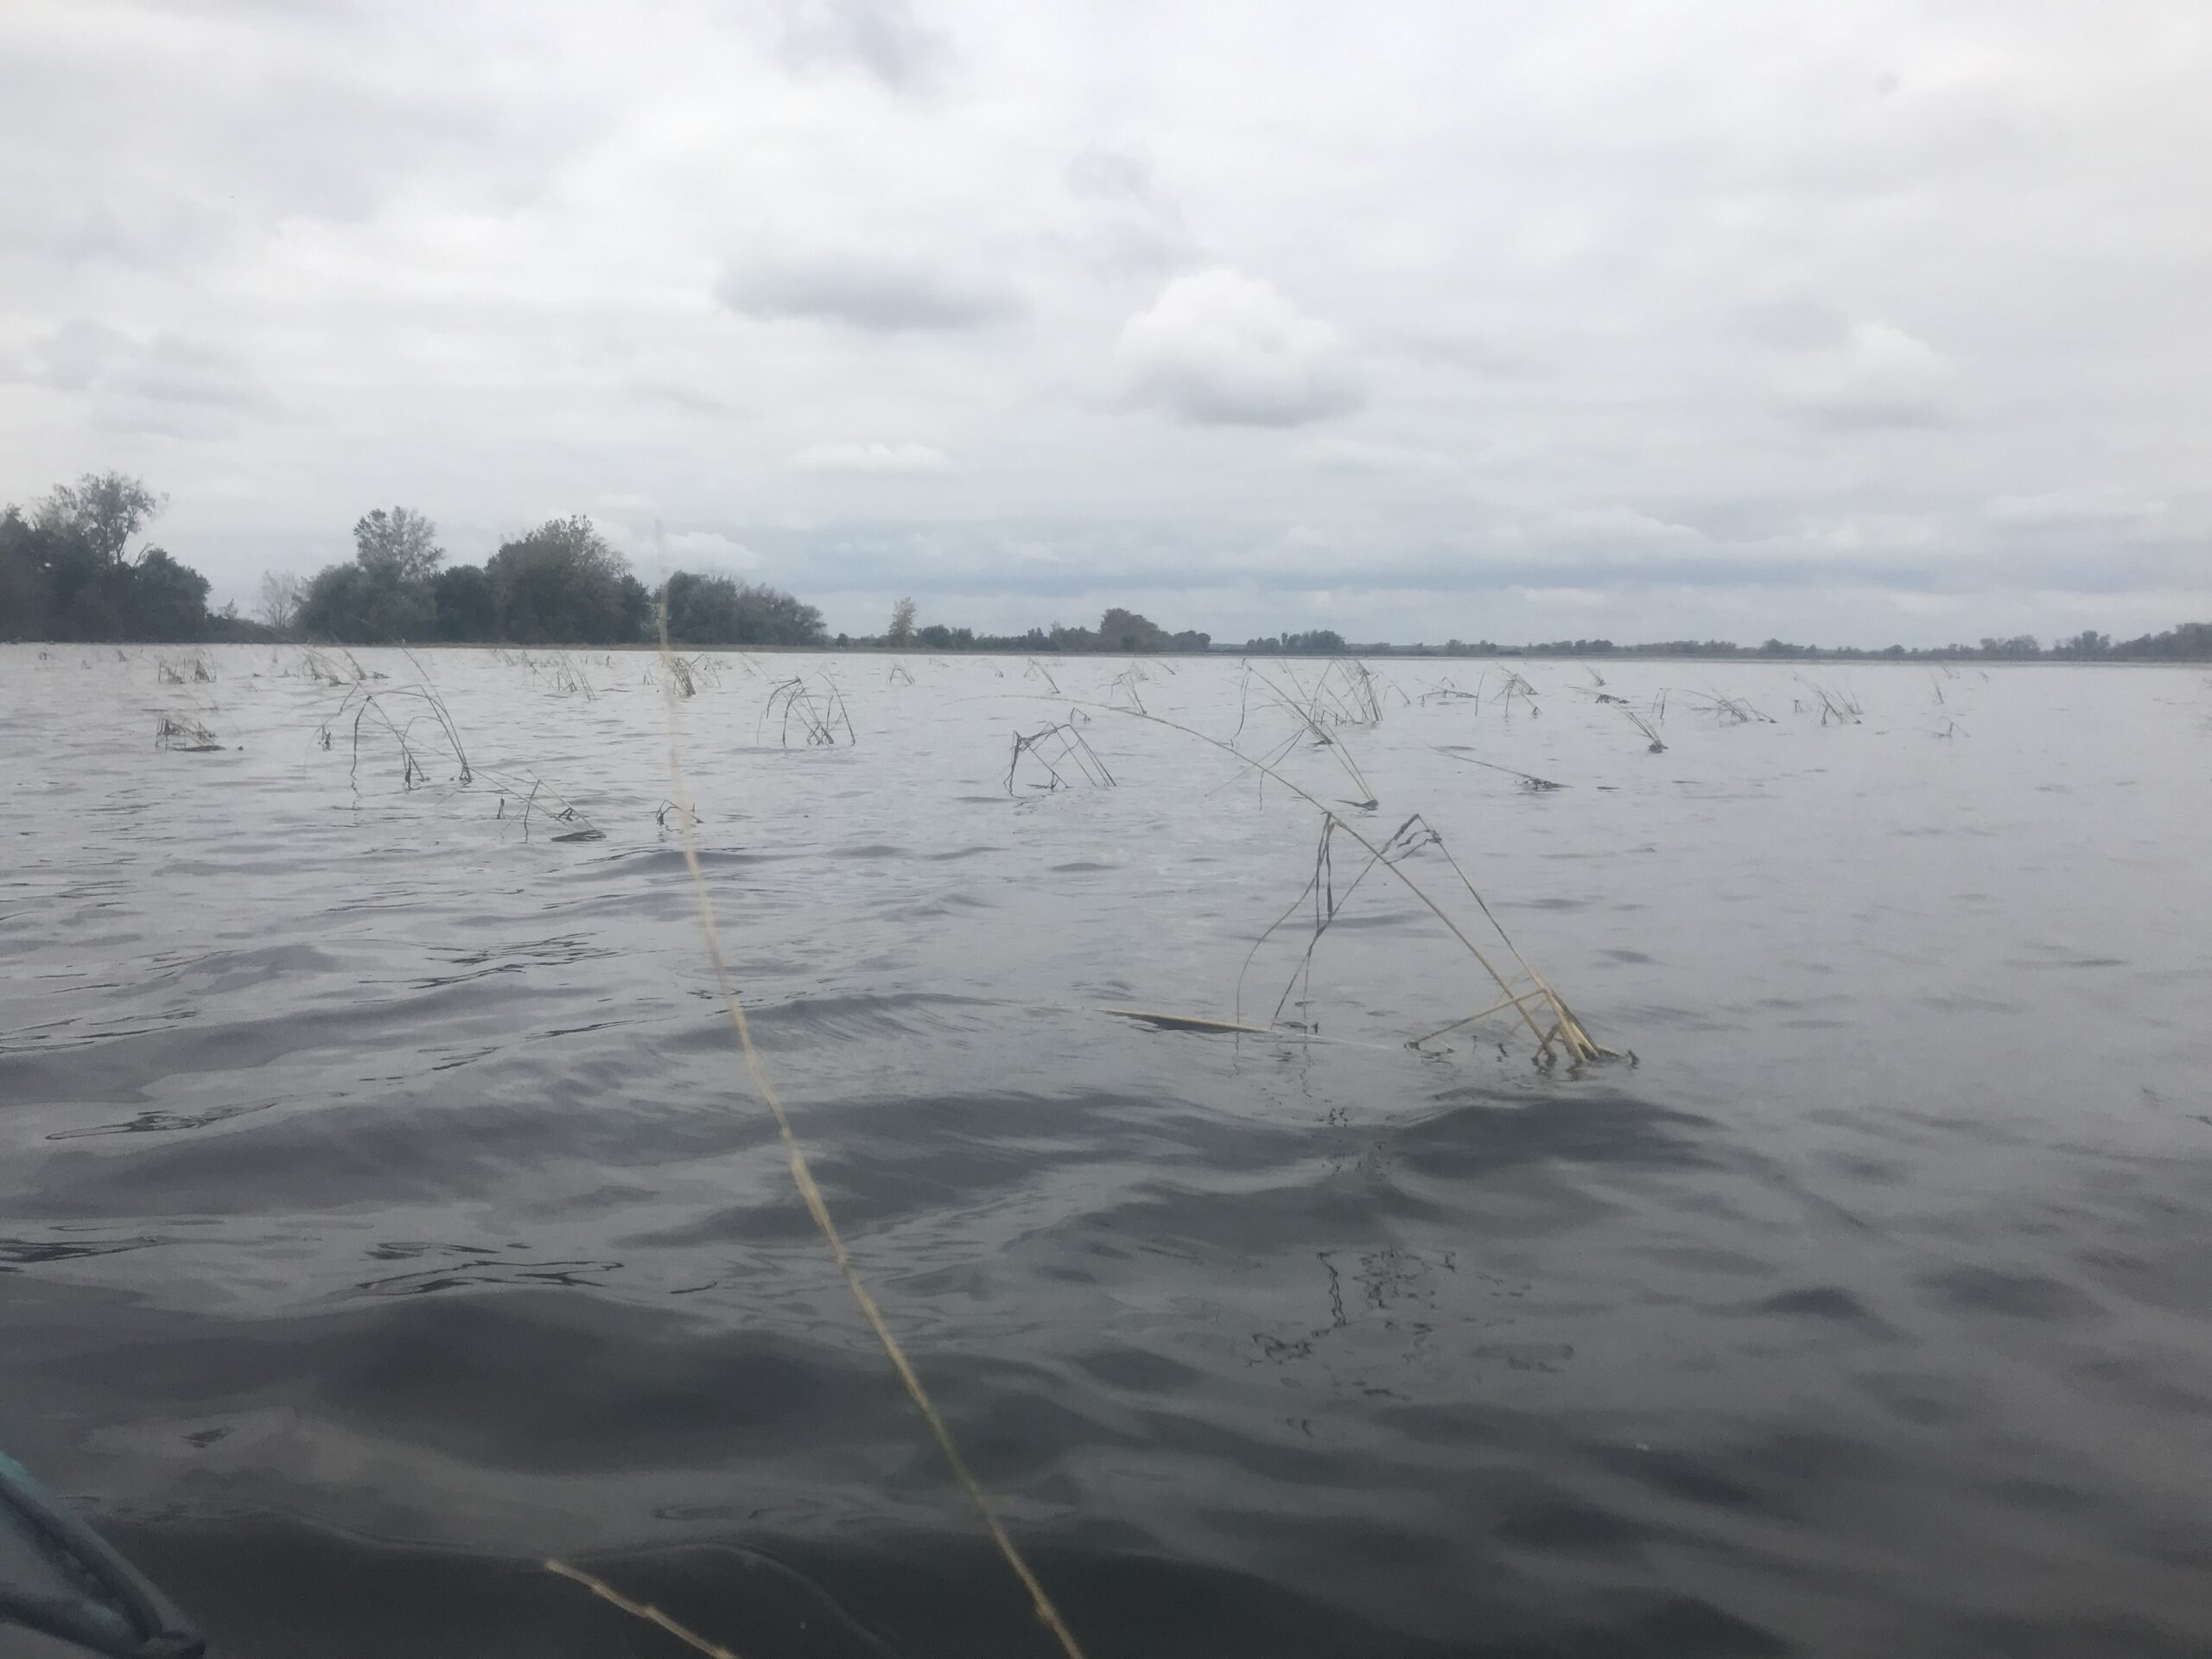
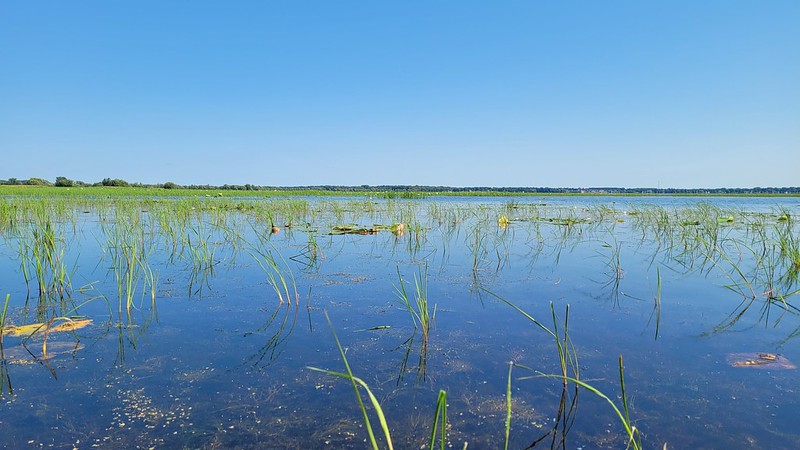
Wild Rice Beds in Summer Conditions
Water levels affect critical habitat areas, like these wild rice beds. Even slight shifts can impact native vegetation, fish spawning zones, and navigation for paddlers.
Stay Connected for More!
Water levels impact everything from fish habitats to your favorite outdoor activities. Stay tuned to our Basin Blog for more upcoming posts highlighting how water level management decisions shape Lake Winnebago’s future—and your next lake adventure.
Want more info right now?