
Blue-green algae, also known as cyanobacteria, can cause adverse health effects because some types of cyanobacteria can produce toxins. Cyanobacteria are photosynthetic (light-using) organisms that are responsible for harmful algal blooms. Not all cyanobacteria produce harmful toxins, but those that do can cause rashes, diarrheal disease, and respiratory problems. In Wisconsin, harmful algal blooms are most common during the warm-weather months between mid-June and mid-September, but they can occur all year.
The National Centers for Coastal Ocean Science developed the Algal Bloom Monitoring System to routinely deliver near-real-time images for use in locating, monitoring and quantifying algal blooms in coastal and lake regions of the US. The Winnebago Waterways/Green Bay is one of seven locations monitored via satellite. While these images can be helpful in assessing the areas to try to avoid before recreating on the lakes, conditions on the lake can change rapidly and may not match the most recently available satellite image.
Harmful blue-green algae blooms are primarily driven by excess phosphorus and have widespread negative ecological and economic impacts, as well as serious risks to human health. Click HERE to learn more about the relationship between phosphorus and blue-green algae.
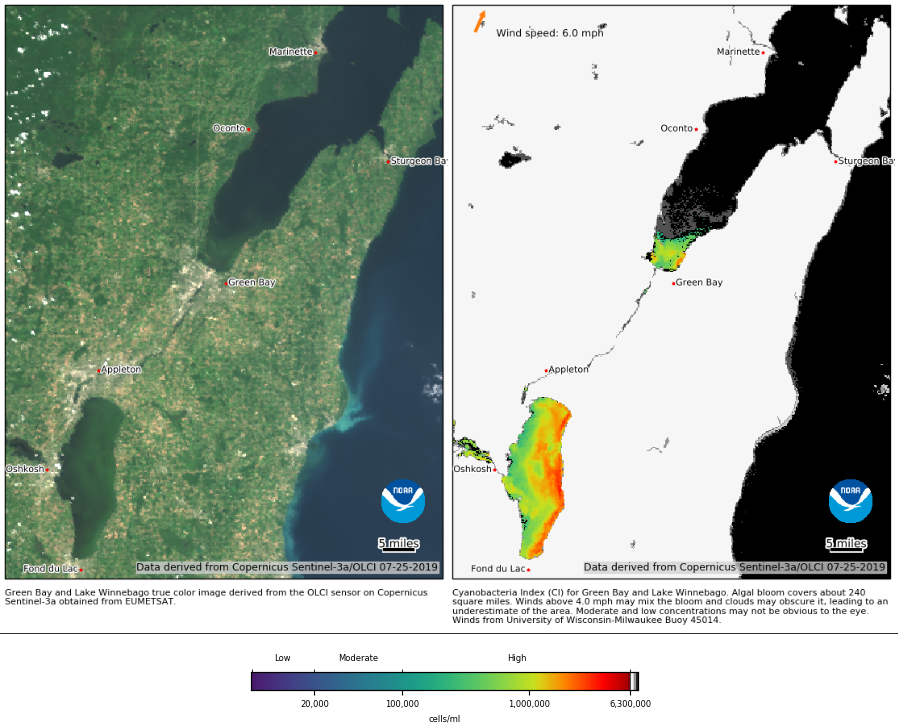
The satellite imagery represents algae concentrations in cells per mL, and only detects blue-green algae. In Wisconsin, there is an advisory level of
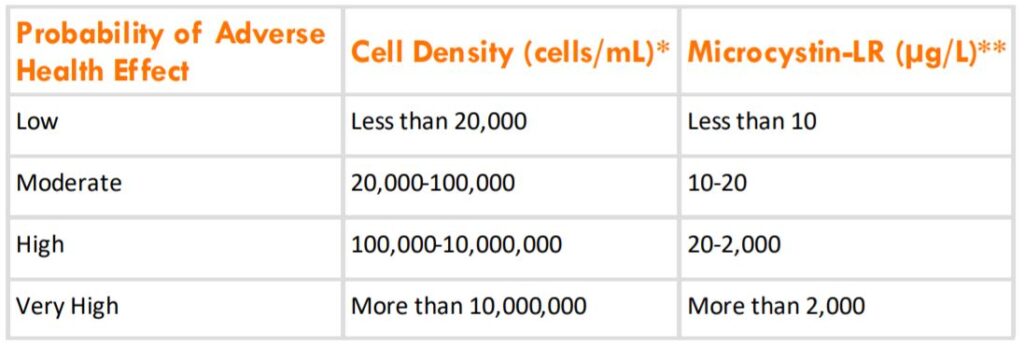
>100,000 cells/mL or if a scum layer is visible. There is an increased risk of adverse health effects relating to harmful algal blooms as the concentrations of algae increase in size. Although toxin concentrations cannot be measured by satellite, cell density of cyanobacteria can be used to estimate health risk of a bloom. This is because the higher the density of cyanobacteria cells the higher the likelihood of higher concentrations of toxins.
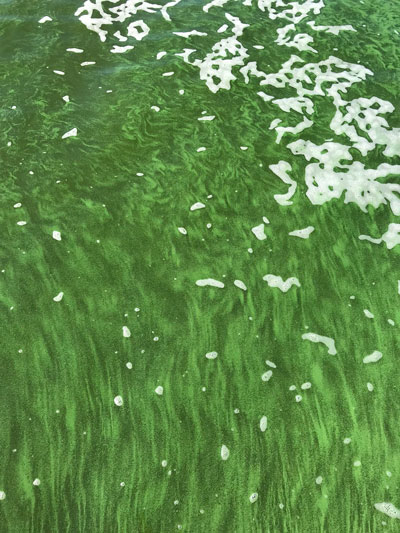
It is important to stay away from these larger blooms, especially when the lake appears to have a green paint layer, looks like pea soup, or a scum layer is present. This information can be found HERE.
*Cell density: The number of cells per unit volume.
**Microcystin-LR: Toxin produces by a type of cyanobacteria that can be measured to determine potential health effect
Each algal toxin can affect your health differently: neurotoxins affect your central nervous system, hepatotoxins cause liver damage. Exposure to algal bloom material can also affect the skin and the gastrointestinal system. Symptoms depend on which toxin and how much of it you are exposed to, and how you are exposed (drinking, swimming, etc.). You can read more information about the health impacts of blue-green algae HERE.
Interpreting the Satellite Images
Green hues on the map represent concentrations that the human eye can pick up (some specks in the water), whereas red-areas indicate areas where blue-green algae scum has likely begun to build up. The satellite measures concentrations of chlorophyll in the cyanobacteria.
This tool represents near-real-time imagery. Images are taken every day. If there is a day missing in the imagery sequence, that’s because the image turned out poorly due to cloud cover or other factors. Conditions can change rapidly, so satellite images posted online may not represent current conditions at specific locations. Be sure to pay attention to the timestamp in the bottom-right of the image, as it could be two or three days old. It is best to use common sense, and avoid using the water if algae is present.
The image shown below is from 08/22/2021. Check out the latest imagery HERE.
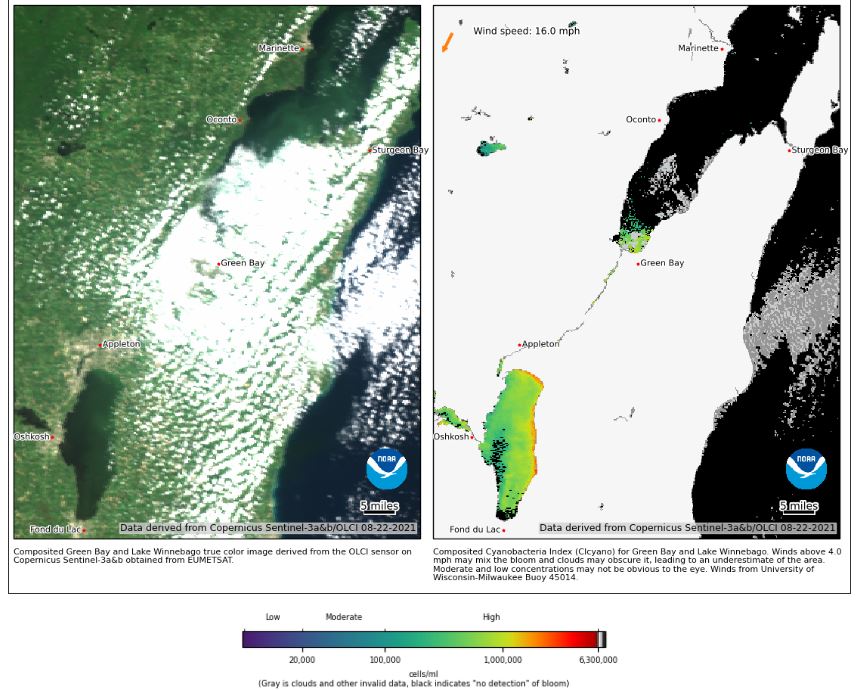
The images are derived from Copernicus Sentinel-3 satellite data from the European Organisation for the Exploitation of Meteorological Satellites (EUMETSAT) and are processed by NOAA, National Centers for Coastal Ocean Science.